on
AMBCrypto
- Get link
- X
- Other Apps
Bitcoin [BTC] recently saw a sharp drop to the low $6,000s, leading many to believe the extended period of non-volatility has given way to a bear’s attack on the #1 cryptocurrency. The lackluster performance of the coin might continue to occur, as the bear holds the coin tightly in its claws.
1-hour: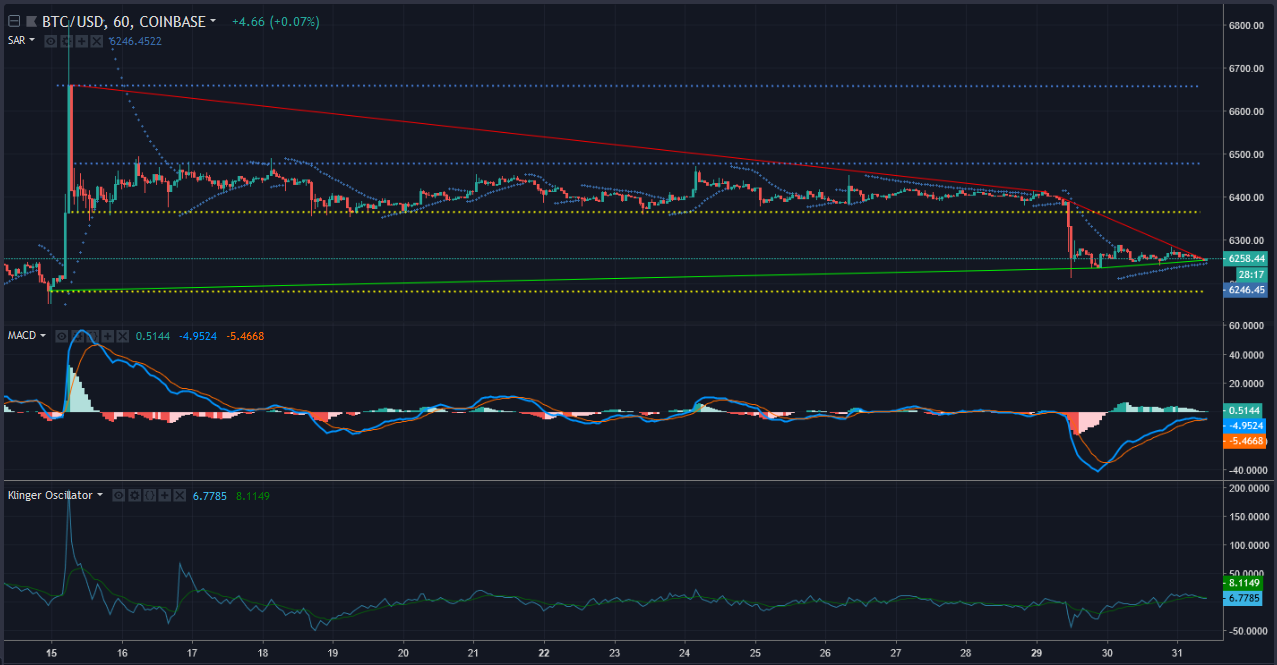
The short-term outlook for Bitcoin shows a support uptrend from $6,185 – $6,255, with a dominant downtrend seen in price movement from $6,660 – $6,410 – $6,260. A lone support holds the price up at $6,180, with resistances set at $6,365, $6,480, and $6,660.
The MACD is demonstrating an unclear outcome, with a possible bearish sign coming soon.
The Klinger Volume Oscillator recently took a bearish turn, forecasting downwards movement of the price.
The Parabolic SAR is bullish, as seen by the presence of the dots under the candlesticks.
1-day: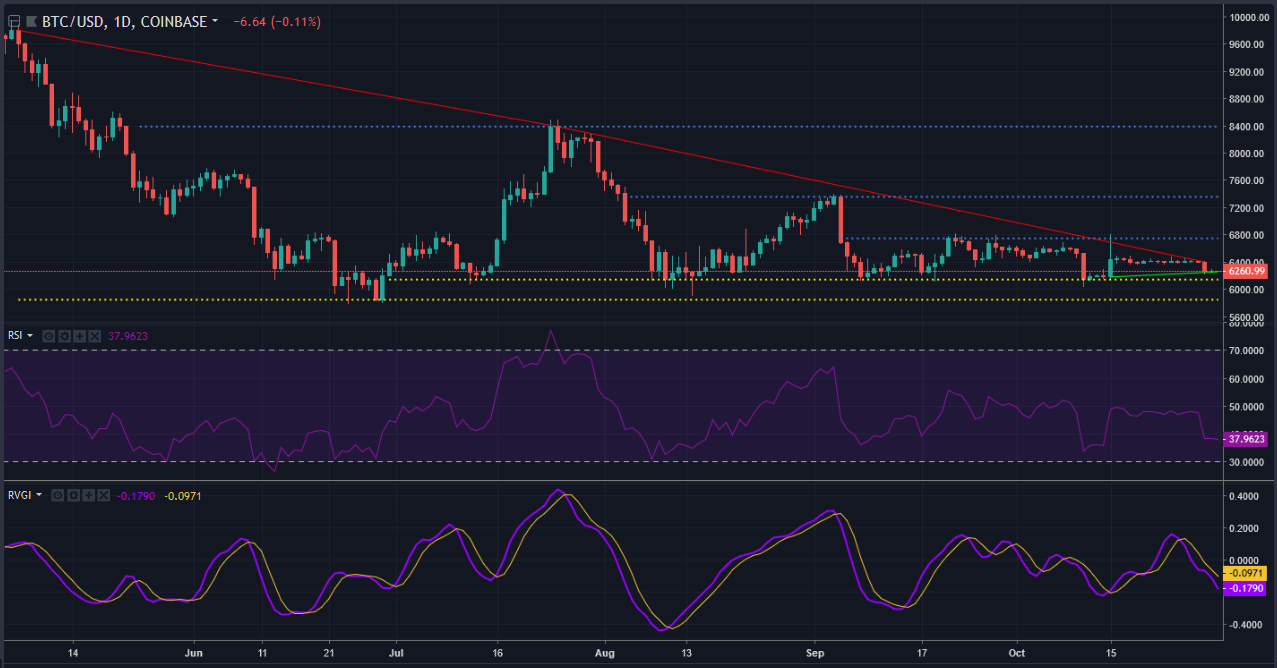
A support uptrend is seen from $6,185 – $6,260, with a downtrend from $9,800 – $6,400 exerting downwards pressure since May. Supports are set at $6,580 and $6,145, with resistance levels at $6,750, $7,360, and $8,390.
The RSI indicates that buying and selling pressure have evened out, and is closer to being in the oversold.
The Relative Vigor Index demonstrated a bearish crossover downward recently and continues to move downwards.
Conclusion
The price of Bitcoin seems set for a tumble. However, if the bear is content with the recent flash crash in the price of Bitcoin, then sideways movement might continue.
The post Bitcoin [BTC/USD] Technical Analysis: Bears settle down to wait as sideways movement looks to start again appeared first on AMBCrypto.
Comments
Post a Comment