on
AMBCrypto
- Get link
- X
- Other Apps
The cryptocurrency market seems to have maintained a sideways movement after the massive bearish drop that occurred a few days back. Cryptocurrencies like Bitcoin [BTC], XRP and Bitcoin Cash [BCH] have all been undergoing a sideways route, with the wrath of the bear still looming large.
1-hour:
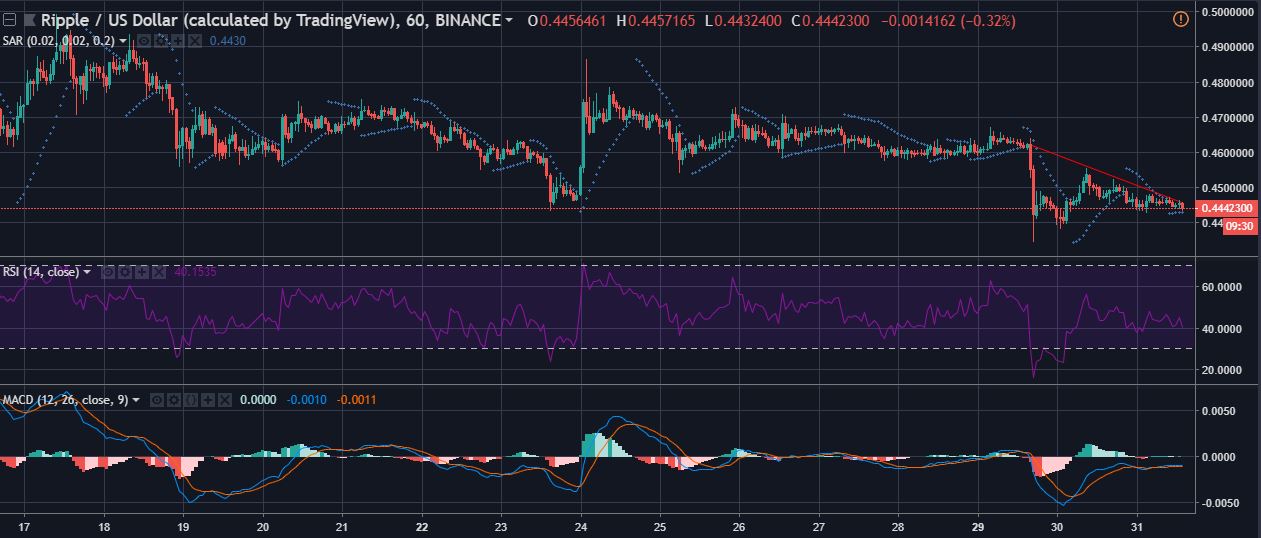
The XRP one-hour graph shows an acute downtrend, with the price falling from $0.46 to $0.44.
The XRP support had fallen to $0.44 during the massive price drop, with the resistance still holding at $0.493.
The Parabolic SAR has indicated a majorly bearish trend, with sporadic bullish spikes in between. At the time of writing, the sideways movement was interspersed with a few bullish spikes, but the bear’s presence was still evident. The markers have mostly stayed above the candles, which is a direct reflection of the bearish market.
The Relative Strength Index [RSI] has been tending towards the oversold zone, which is a sign of the selling pressure overtaking the buying pressure. During the recent bearish drop, XRP had even breached the oversold zone. At the time of writing, the RSI graph was indicating another trip towards the oversold zone.
The MACD graph has been moving as a conjoined pair, which is indicative of the sideways movement. The MACD histogram has been flattened to almost zero, a result of the bear’s pressure on the market.
1-day:

The one-day XRP graph shows a downtrend after the coin had spiked to reach bullish highs. At the time of writing, the downtrend had caused XRP to fall from $0.579 to $0.466. The one-day support has been maintained at $0.261.
The Bollinger bands have started converging after two massive price outbreaks, which is shown by the two Bollinger clouds. The upper and the lower Bollinger band converging is a result of the persistent sideways movement of the XRP market and lack of any drastic price changes.
The Chaikin Money Flow indicator has been staying below the axis, a bearish indicator. At the time of writing, the graph has taken a sudden hairpin turn towards the axis. The upturn is a sign of the money coming back into the market on the back of a change in the investor sentiments.
Conclusion
The sideways movement of the market will continue to persist with a majority of the indicators pointing to that very fact. Only the Chaikin Money Flow indicator has taken the side of the bull, with the bear’s hold still holding strong.
The post XRP [XRP/USD] Technical Analysis: Bear takes a rest after bloodbath as the market moves sideways appeared first on AMBCrypto.
Comments
Post a Comment