on
AMBCrypto
- Get link
- X
- Other Apps
Ethereum [ETH], the third-largest cryptocurrency, has still not regained its second position. The coin, which lost its position to XRP, sprinkled hopes on the investors by glowing green starting this week. Nonetheless, it seems like the bear weather could continue for a longer duration and not end this week.
According to CoinMarketCap, at press time, Ethereum was trading at $116.82, with a market cap of $12.09 billion. The coin had a trading volume of $2.12 billion and had plunged by 5.70% in the past seven days, at the time of writing.
1-hour
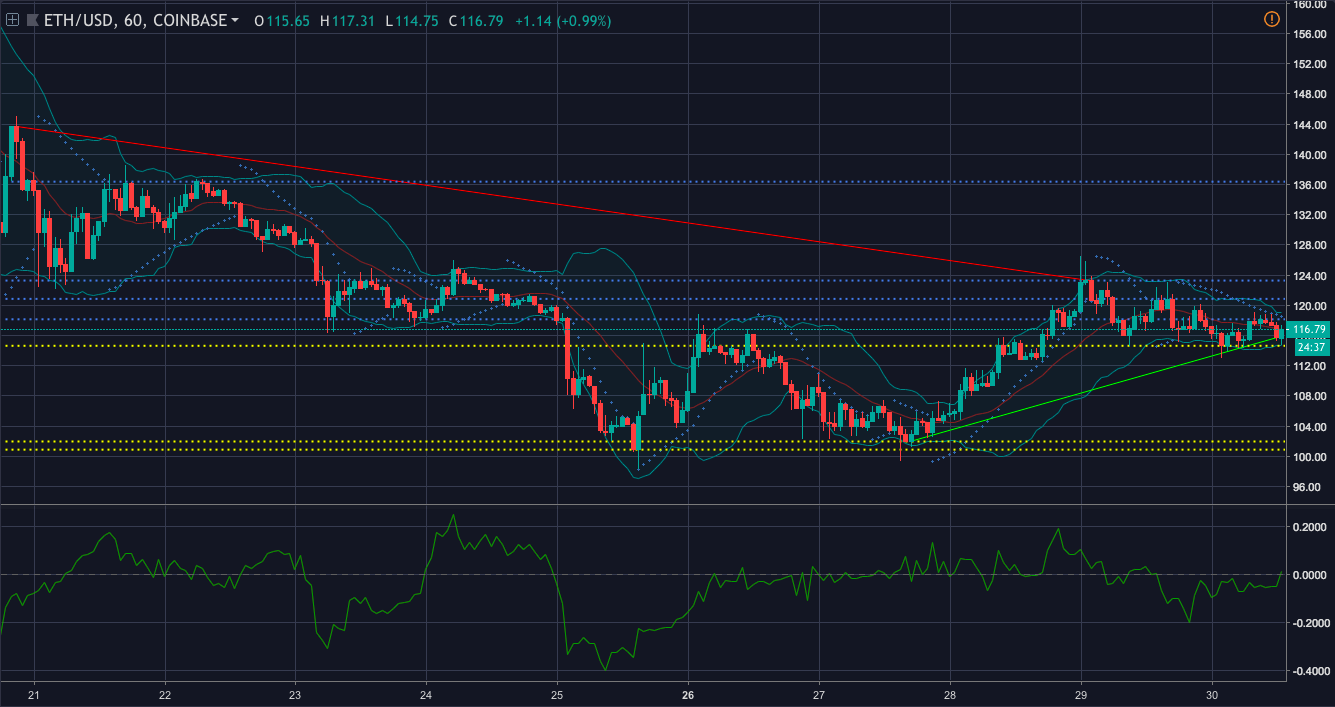
Ethereum one-hour price chart | Source: Trading View
In the one-hour chart, the coin demonstrates a downtrend from $143.69 to $123.25. It also pictures an uptrend from $102.01 to $115.72. It has an immediate resistance at $118.16 and a strong resistance at $123.28. The chart shows that the coin has an immediate support at ground at $114.65 and a strong support at $100.89.
Parabolic SAR is currently displaying its support to the bear as the dots have started to align above the candlesticks.
Bollinger Bands are forecasting a less-volatile market as the bands have started to contract.
Chaikin Money Flow is holding the bull’s flag as the line is above the zero mark, showing that the money is flowing into the market.
1-day
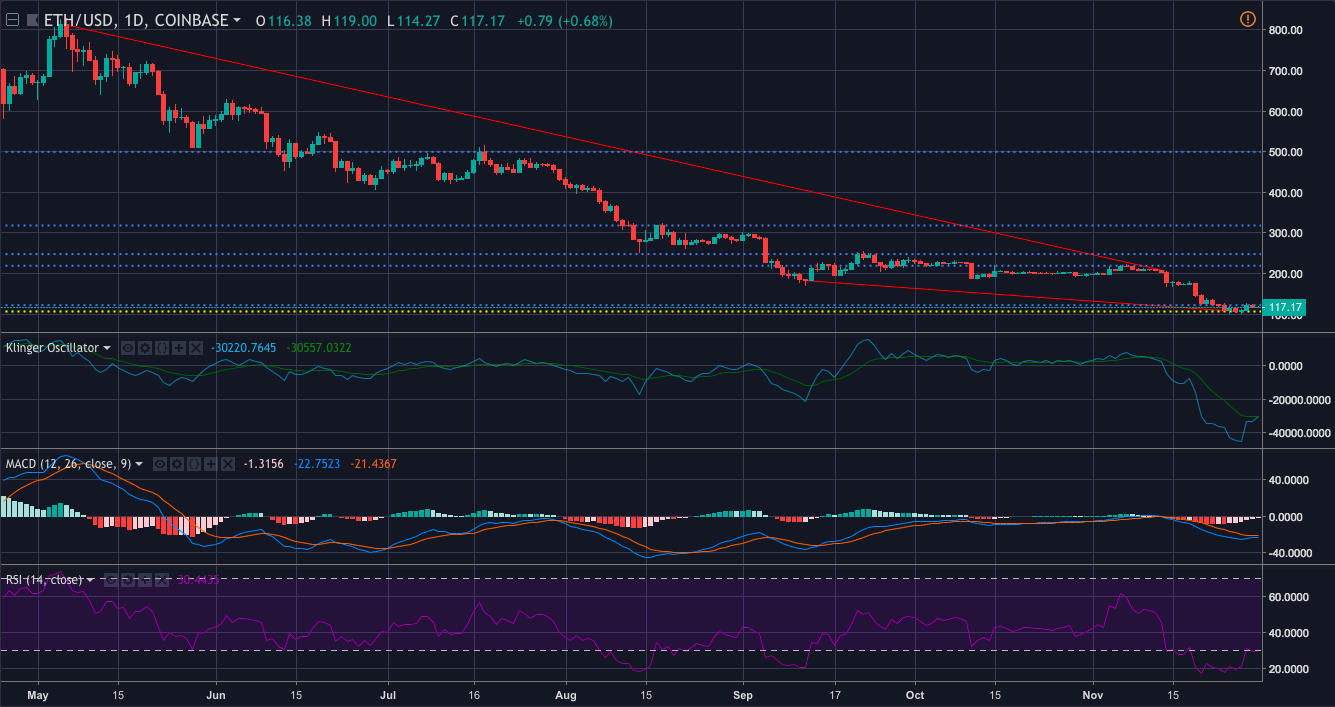
Ethereum one-day price chart | Source: Trading View
In the one-day chart, the coin has a downtrend from $812 to $208.77. It also pictures a steep downfall from $182.79 to $106.95. According to the chart, there is no significant uptrend for the cryptocurrency. It has an immediate resistance at $122.26, and a strong resistance at $129.28. The coin has a support ground at $106.72.
RSI is currently showing its support to the bull as the coin is recovering from the oversold zone.
MACD is on the bear’s side as the moving average line has made a crossover only to take the route down the hill. Nonetheless, a trend reversal could occur as the lines are at the verge of another crossover.
Klinger Oscillator is on the bull’s side of the market as the reading line has made a bullish crossover.
Conclusion
The bear is supported by Parabolic SAR from the one-hour chart and the MACD from the one-day chart. The Klinger Oscillator and the RSI from the one-day chart and the CMF from the one-hour chart are showing its support to the bull.
The post Ethereum [ETH/USD] Technical Analysis: Bears tighten their grip over the market appeared first on AMBCrypto.
Comments
Post a Comment