on
AMBCrypto
- Get link
- X
- Other Apps
The cryptocurrency market has seen constant ups and down in the market and many of them have made major shifts in position. However, the market seems to keep on nudging the coins by a peck and for the third-largest coin on the top-10 cryptocurrency list, Ethereum [ETH], a rough ride has ensued ever since the market started changing. However, the coin did manage to stay in the third position and not slip from its rank like many other major coins.
According to CoinMarketCap, ETH was valued at $140.24, with a market cap of $14.5 billion, at press time. The 24-hour trade volume of the coin was reported to be $3 billion, with a hike of 3.10% over the past 24 hours. The coin registered an overall growth of 8.25% over the past week and is going steady with a 0.43% rise over the hour.
1-hour
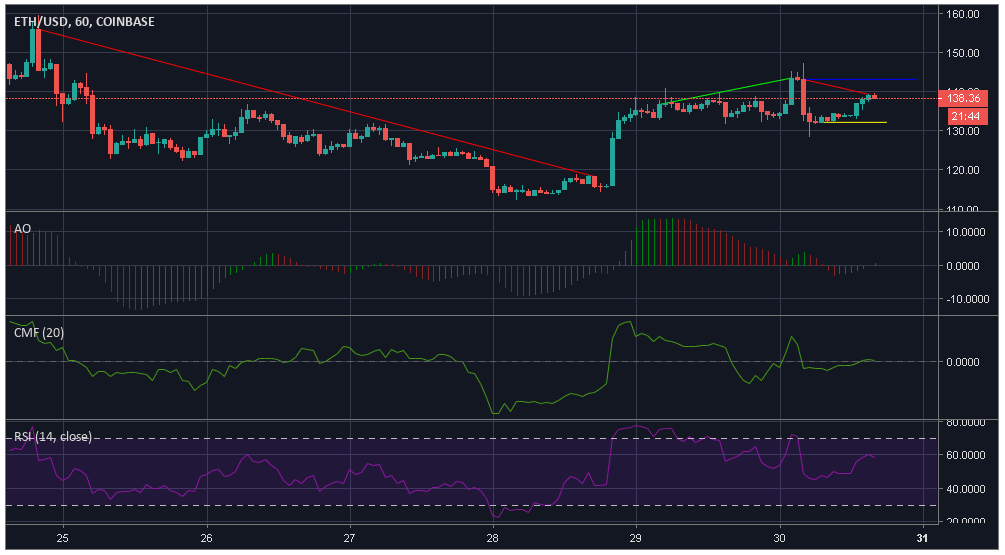
Source: Trading View
The one-hour chart of Ethereum reports an uptrend from $136.82 to $143.55, however, the chart also indicates a downfall in the value of the coin from $156.04 to $128.34 after which it registered the aforementioned uptrend. The coin then fell from $143.22 to $239.38. The market has marked a resistance for the coin at $143.22 and has offered strong support at $132.21.
Awesome Oscillator indicates a bullish market gaining momentum.
Chaikin Money Flow marker is barely above zero and might fall under zero soon. However, the money is flowing outside the market and marks a bearish trend.
Relative Strength Index showcases that the buying and selling pressures are evening each other out, as the marker line recovers from an overbought bearish zone.
1-day
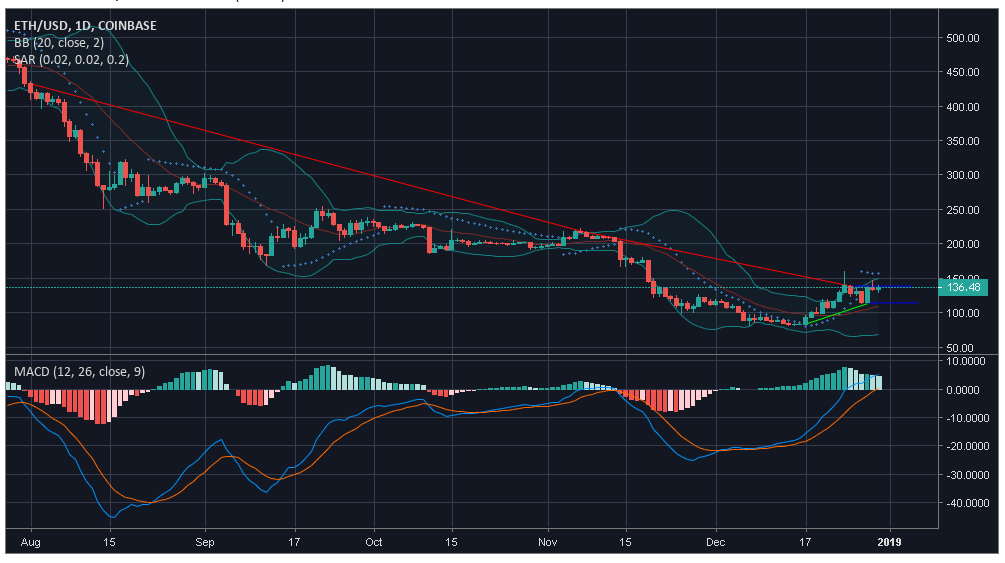
Source: Trading view
As per the one-hour chart of the coin, a downtrend was observed from $432.36 to $218.66 which further continues till $139.02. A minimal uptrend was observed from $83.74 to $114.53. The coin registered a resistance at $139.02 while reporting support at $114.53.
Bollinger Bands are indicating a bullish run for the coin as the moving average line is under the candlesticks. The bands appear to be at a diverging point, thus increasing the volatility in the market.
Parabolic SAR points towards a bearish market as the markers align themselves above the candles.
MACD line is above the signal line, marking a bullish market, but is moving towards a crossover.
Conclusion
At the time of press, the bull seems to be taking back its territory. The indicators Awesome Oscillator, Chaikin Money Flow, Bollinger Bands, and, MACD line predict a bullish market. However, indicator Parabolic SAR points towards a lurking bear.
The post Ethereum [ETH] Technical Analysis: Bull takes over as wounded bear heals appeared first on AMBCrypto.
Comments
Post a Comment