on
AMBCrypto
- Get link
- X
- Other Apps
Key Highlights
Ripple price is struggling to gain bullish momentum against the US Dollar and Bitcoin. XRP/USD remains well supported on the downside near $0.3460.
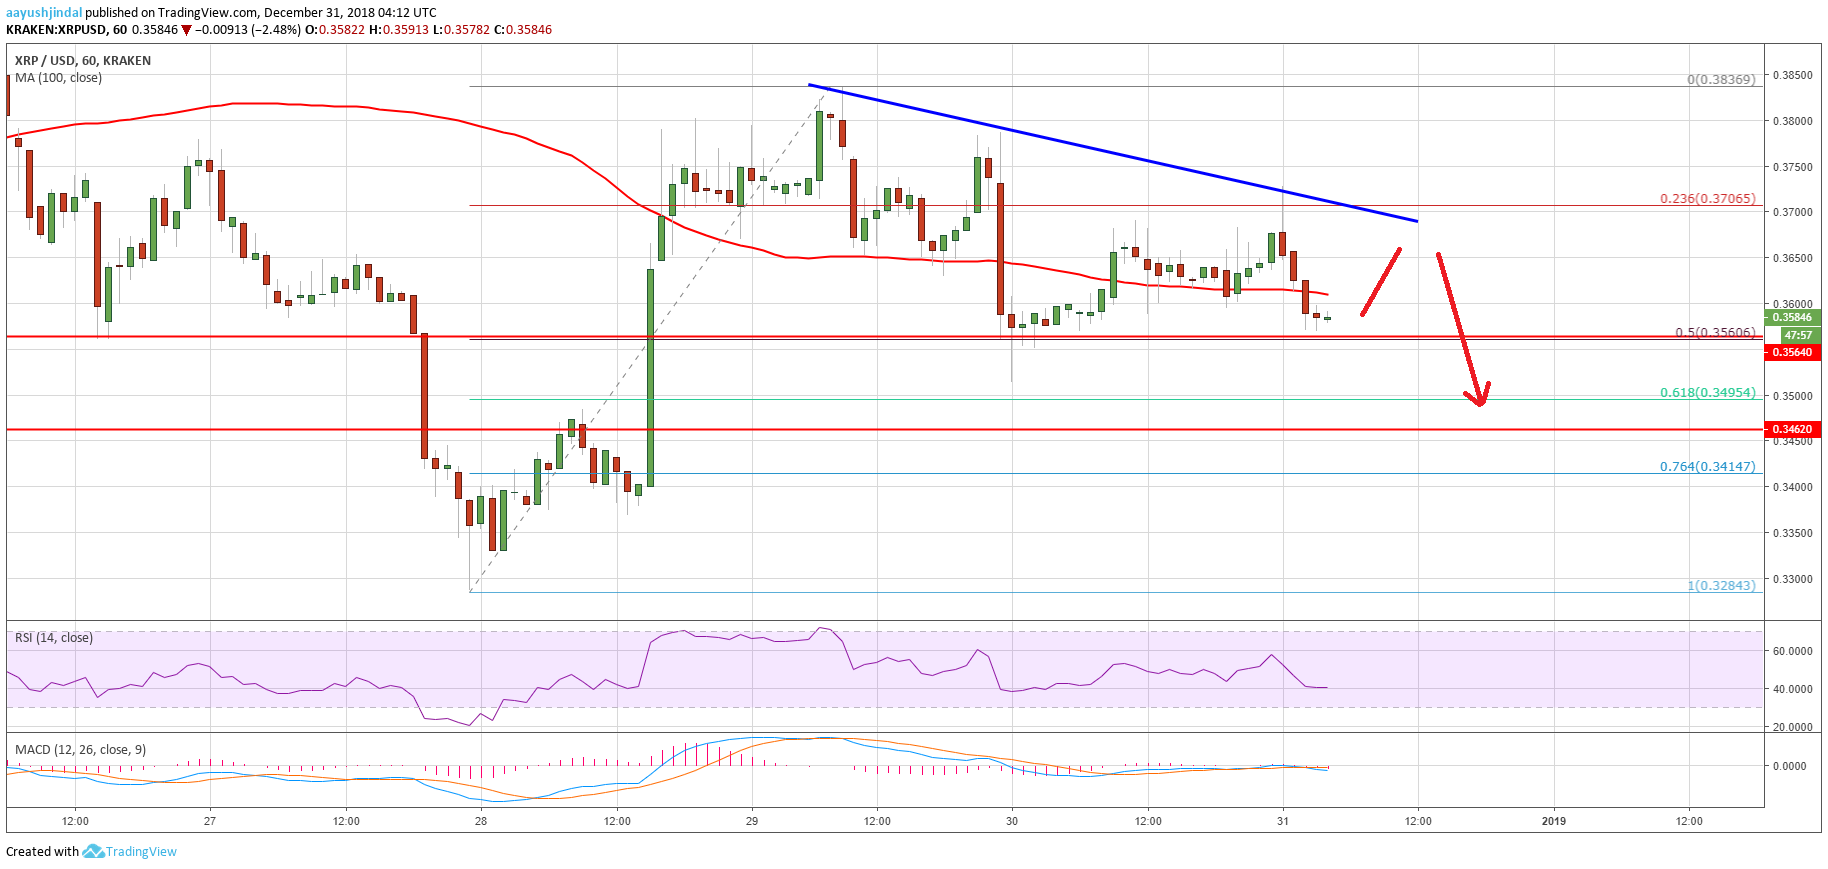
After forming a solid support near $0.3280, ripple price started an upward move against the US Dollar. The XRP/USD pair broke the $0.3460, $0.3500 and $0.3700 resistance levels. There was even a break above the $0.3800 level and the 100 hourly simple moving average. However, the pair struggled to gain momentum above the $0.3800 level, formed a high at $0.3836 and later started a downside correction.
It broke the $0.3700 support and the 100 hourly SMA. There was a break below the 23.6% Fib retracement level of the last wave from the $0.3284 low to $0.3836 high. However, the $0.3500 support is currently acting as a solid support. It represents the 50% Fib retracement level of the last wave from the $0.3284 low to $0.3836 high. If there is a downside break, the price may find bids near the $0.3460 support. The main support is near the $0.3280-0.3300 zone. On the upside, there is a major bearish trend line formed with resistance at $0.3700 on the hourly chart of the XRP/USD pair.

Looking at the chart, ripple price seems to be preparing for more losses below the $0.3500 support. However, losses could be limited and the price might bounce back from $0.3460 or $0.3300. On the upside, a break above $0.3700 and $0.3800 is needed for a run to $0.4000.
Looking at the technical indicators:
Hourly MACD – The MACD for XRP/USD is slightly in the bearish zone.
Hourly RSI (Relative Strength Index) – The RSI for XRP/USD is now below the 50 level.
Major Support Level – $0.3460
Major Resistance Level – $0.3800
The post Ripple Price Analysis: XRP Could Correct Lower Before Clearing $0.40 appeared first on NewsBTC.
Comments
Post a Comment