on
AMBCrypto
- Get link
- X
- Other Apps
The cryptocurrency market was painted with both red and green this month, with the majority of the days going green. The festive month also chose to keep the bear’s brutality at bay as the bull took the oath of protecting the coins from a massive plunge. However, as the month is nearing its end, the market seems to be at the verge of losing its power to the bear again.
According to CoinMarketCap, at press time, Tron was trading at $0.0197 with a market cap of $1.31 billion. The cryptocurrency holds a trade volume of $68.26 million and has plunged by more than 12% in the past seven days.
1-hour
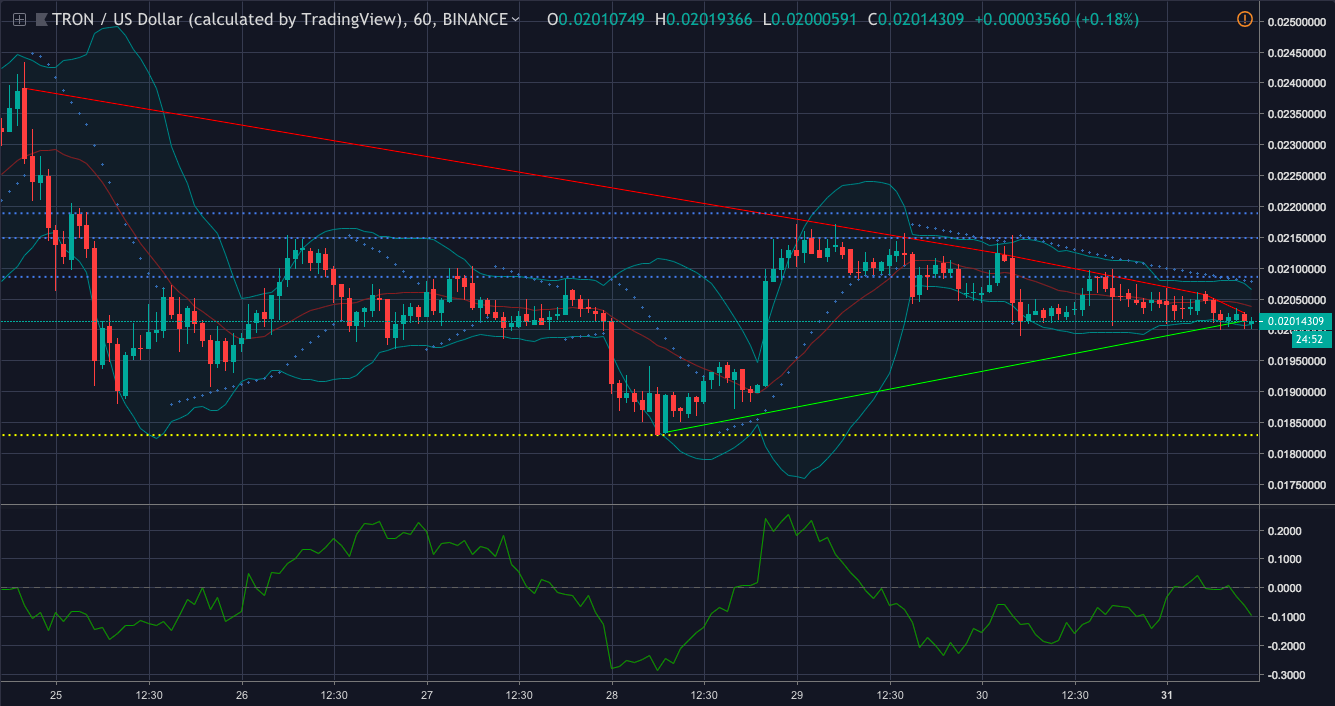
Tron one-hour price chart | Source: Trading View
The one-hour chart is demonstrating a downtrend from $0.0239 to $0.0212 and further down to $0.0205. It is also showing another slight downwards trend, which is from $0.0207 to $0.0205. The uptrend has found its starting point at $0.0183 and its ending point $0.0201.
The immediate resistance for the coin is recorded to be placed at $0.0208 and the strong resistance at $0.0218. The cryptocurrency’s price level of $0.0182 has stepped forward to help the coin in case the bear attempts to strike down the coin.
Parabolic SAR is indicating that the bull is currently worn out, giving the bear the benefit of regaining its position in the market. This is because the dots have started to align on top of the candlesticks.
Bollinger Bands is showing that the two market players are not going to collide soon, as it is forecasting a less volatile market.
Chaikin Money Flow is showing that the money is flowing out of the market, indicating that the bull is severely injured because of the constant battle.
1-day
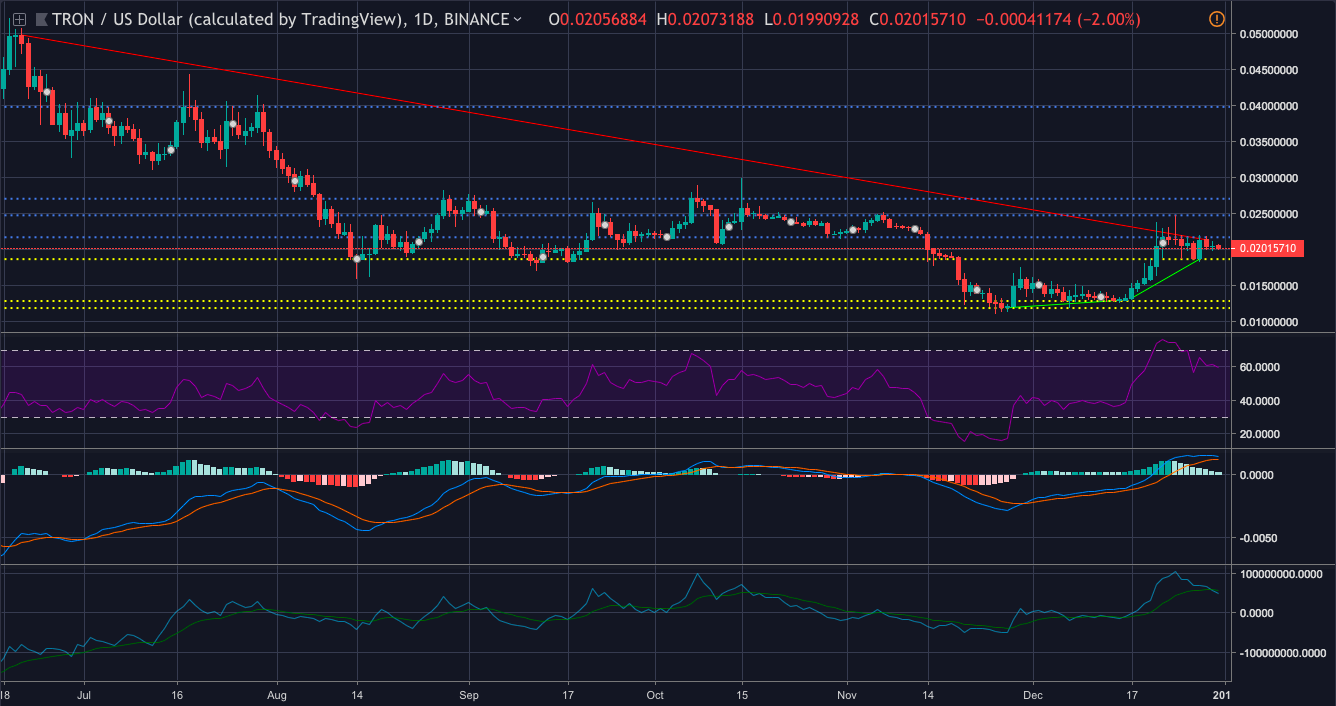
Tron one-day price chart | Source: Trading View
In the one-day chart, the cryptocurrency is showing a downtrend from $0.0498 to $0.0213. The chart also shows the coins progress this month as it records two uptrends, the first from $0.0119 to $0.0129, and the second from $0.0132 to $0.0186.
The coin is going to face the immediate resistance at $0.0217 and the strong resistance at $0.0398. The immediate support for the cryptocurrency is currently at $0.0186 and the strong support at $0.0118.
Klinger Oscillator shows that the bear has managed to break-down a wall in the market, as the indicator is showing that the reading line has made a crossover only to go south.
RSI is showing that the buying pressure and the selling pressure for the coin is currently evened out in the market.
MACD is still holding strong next to bull, however, it picturing that there is an imminent crossover in the pipeline.
Conclusion
The bull is showing signs of exhaustion as it has lost several indicators to the bear. This includes the Klinger Oscillator from the one-day chart, Parabolic SAR, and Chaikin Money Flow from the one-day chart.
The post Tron [TRX/USD] Technical Analysis: Bull at the verge of losing coin to bear appeared first on AMBCrypto.
Comments
Post a Comment